
Solar Panel Monitoring Ireland 2026: Best Apps, What to Watch & When to Call Your Installer
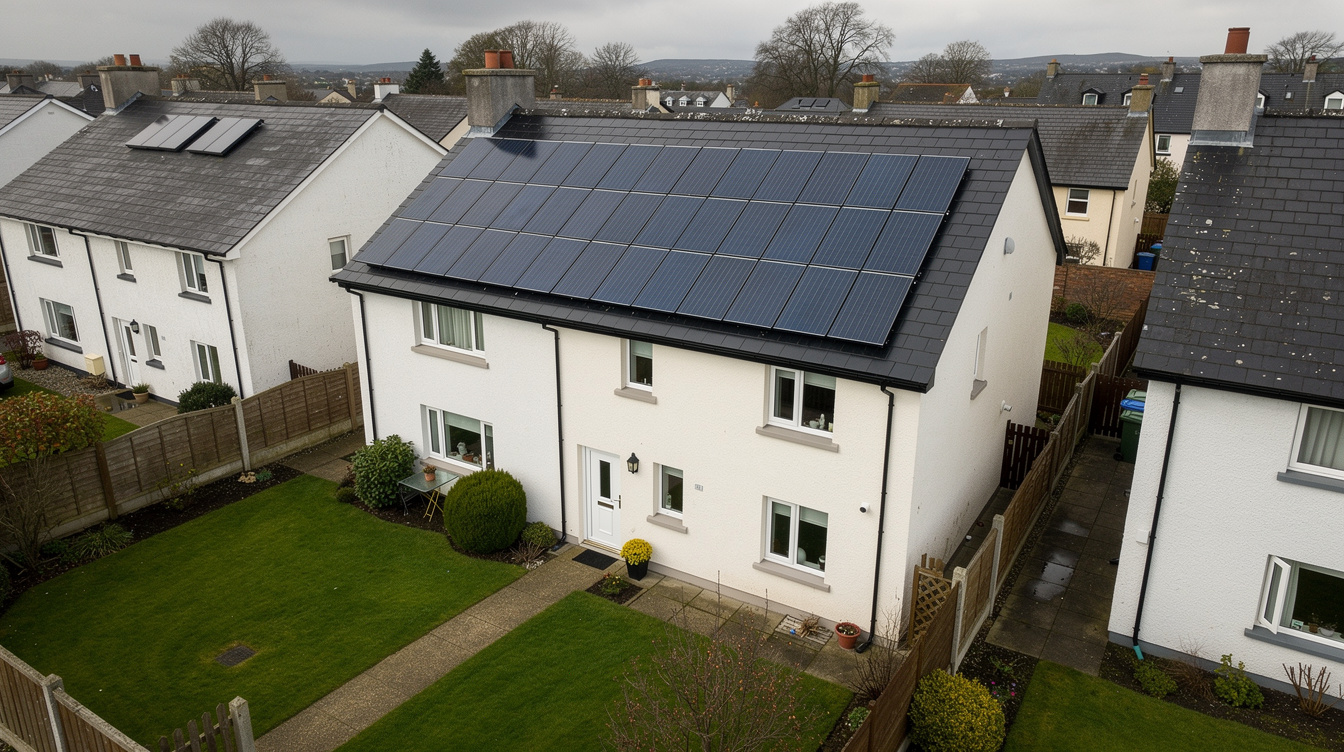
Your solar panels are on the roof, the inverter is humming, and your electricity bills have dropped. But how do you know if your system is actually performing as well as it should? The answer is monitoring — and in 2026, every major inverter brand gives you a free app that turns your phone into a real-time solar power station dashboard.
This guide covers every monitoring platform available to Irish homeowners, explains what numbers to watch, shows you how to spot problems before they cost you money, and tells you exactly when it's time to call your installer.
Why Monitoring Your Solar Panels Matters
A typical 5 kW solar system in Ireland generates €900–€1,400 worth of electricity per year. If a fault goes undetected — a tripped inverter, a shaded panel, a loose cable — you could lose €50–€200 before you even notice something is wrong.
Without monitoring, the only clue you might get is a higher-than-expected electricity bill. With monitoring, you get instant alerts, daily production graphs, and historical data that makes problems obvious at a glance.
Monitoring is especially important in Ireland because of our variable weather. A system that produces 25 kWh on a sunny June day might produce just 3 kWh on a dark December day — and that's completely normal. But if your June output suddenly drops from 25 kWh to 15 kWh, monitoring will flag it immediately.
Thinking About Going Solar?
Get your free personalised quote from SEAI-registered installers and start monitoring your own production.
The 6 Best Solar Monitoring Apps in Ireland (2026)
The monitoring app you use depends on which inverter your installer fitted. Here's every major platform available in Ireland, compared side by side.
| Platform | Inverter Brand | Panel-Level Data | Battery Monitoring | Cost |
|---|---|---|---|---|
| Huawei FusionSolar | Huawei Sun2000 | Yes (with optimisers) | Yes (LUNA2000) | Free |
| mySolarEdge | SolarEdge | Yes (always) | Yes | Free |
| GivEnergy Portal | GivEnergy | No | Yes (best-in-class) | Free |
| Enphase Enlighten | Enphase | Yes (always) | Yes | Free |
| Fronius Solar.web | Fronius | No | Yes (BYD) | Free |
| SMA Sunny Portal | SMA | No | Yes | Free |
Every platform above is free and included with the inverter. You should never have to pay extra for basic monitoring.
Huawei FusionSolar — The Irish Market Leader
Huawei Sun2000 inverters are the most commonly installed inverters in Ireland in 2026, and FusionSolar is their monitoring platform. The app shows real-time generation, daily/monthly/yearly graphs, and — if you have a LUNA2000 battery — charge/discharge cycles and state of charge.
With power optimisers installed (which many Irish installers now fit as standard), you can monitor individual panel output. This is invaluable for spotting a single underperforming panel caused by shading, bird droppings, or a micro-crack.
Best for: Most Irish homeowners. If your installer used Huawei equipment, this is your go-to app.
mySolarEdge — Best Panel-Level Monitoring
SolarEdge systems always include power optimisers on every panel, which means you automatically get panel-level monitoring. The mySolarEdge app shows a visual layout of your roof with each panel's output colour-coded — green for good, orange for underperforming, red for fault.
This makes it exceptionally easy to spot problems. If one panel drops to half the output of its neighbours, you'll see it immediately on the map view.
Best for: Homeowners who want the most detailed monitoring without any add-ons.
GivEnergy Portal — Best for Battery Management
GivEnergy's monitoring platform stands out for battery management. You can set charging schedules (e.g., charge from the grid on cheap night rates), configure export limits, and see exactly how your battery cycles through the day.
While it doesn't offer panel-level monitoring, the battery analytics are the best available. If you're on a time-of-use tariff like Electric Ireland's Smart Saver or Bord Gáis Energy's SmartSaver, GivEnergy's scheduling features can save you an extra €150–€300 per year by charging on cheap rates overnight.
Best for: Homeowners with GivEnergy batteries who want to maximise savings on time-of-use tariffs.
Enphase Enlighten — Best Microinverter Monitoring
Enphase uses microinverters (one per panel) instead of a single string inverter. This means Enlighten automatically shows individual panel performance. The system is less common in Ireland than Huawei or SolarEdge, but it's growing in popularity, particularly for complex roof layouts with multiple orientations.
Best for: Homes with microinverter systems and complex roofs (east/west splits, dormers, multiple roof sections).
Fronius Solar.web and SMA Sunny Portal
Both are solid, reliable monitoring platforms. Fronius is popular with some Irish installers for larger residential and commercial systems. SMA's Sunny Portal excels at multi-site monitoring, making it a good choice for homeowners with a holiday home or commercial property with solar.
What Numbers Should You Be Watching?
Monitoring apps throw a lot of data at you. Here are the key metrics that actually matter for Irish homeowners.
| Metric | What It Tells You | Healthy Range (Ireland) |
|---|---|---|
| Daily Generation (kWh) | Total electricity produced today | 2–5 kWh (winter) to 20–30 kWh (summer) for 5 kW system |
| Self-Consumption Rate | % of solar energy used in your home | 30–50% (no battery) or 60–85% (with battery) |
| Export (kWh) | Surplus sent to the grid | Lower is generally better (you earn 18–24c but save 37–42c by self-consuming) |
| Specific Yield (kWh/kWp) | Annual output per kW of capacity | 850–1,050 kWh/kWp typical for Ireland |
| Battery State of Charge | How full your battery is | Should cycle daily: full by afternoon, empty by morning |
Seasonal Output Expectations for Ireland
One of the biggest mistakes new solar owners make is comparing their December output to their July output and panicking. Ireland's solar resource varies dramatically by season. Here's what a healthy 5 kW system should produce each month:
| Month | Daily Average (kWh) | Monthly Total (kWh) |
|---|---|---|
| January | 2–4 | 60–120 |
| February | 4–7 | 110–195 |
| March | 8–12 | 250–370 |
| April | 12–18 | 360–540 |
| May | 15–22 | 465–680 |
| June | 16–25 | 480–750 |
| July | 15–23 | 465–715 |
| August | 12–19 | 370–590 |
| September | 8–14 | 240–420 |
| October | 4–8 | 125–250 |
| November | 2–4 | 60–120 |
| December | 1–3 | 30–90 |
If your output falls significantly below these ranges for your system size, that's a genuine red flag worth investigating.
Ready to Go Solar?
Get your free personalised quote from SEAI-registered installers.
How to Set Up Monitoring (Step by Step)
Most installers will set up monitoring for you before they leave. But if yours didn't, or if you need to reconnect after a Wi-Fi change, here's how:
- Download the app for your inverter brand (FusionSolar, mySolarEdge, GivEnergy, Enlighten, Solar.web, or Sunny Portal) from the App Store or Google Play.
- Create an account using the email you gave your installer. Many installers register the system under your email during commissioning.
- Connect the inverter to Wi-Fi. Most modern inverters have built-in Wi-Fi or a dongle. You'll typically scan a QR code on the inverter or use the app's pairing mode. Huawei inverters use a dedicated WLAN dongle; SolarEdge connects via the SetApp installer tool.
- Verify data is flowing. Check that the app shows today's generation. It can take 15–30 minutes for the first data to appear.
- Set up alerts. Most apps let you configure email or push notifications for faults, low output, or communication loss. Turn these on — they're your early warning system.
Tip: If your inverter is in the garage or utility room with poor Wi-Fi signal, ask your installer about a powerline adapter or a Wi-Fi extender. A dropped connection means gaps in your monitoring data.
5 Warning Signs Your System Isn't Performing
Here are the red flags to watch for in your monitoring data, and what to do about each one.
1. Sudden Drop in Daily Output
If your system was producing 20 kWh per day and suddenly drops to 10 kWh on a similar weather day, something is wrong. Common causes: tripped inverter, blown fuse, or a faulty panel string.
What to do: Check your inverter for error codes or warning lights. If the inverter shows a red light or an error on the display, take a photo and contact your installer.
2. One Panel Producing Much Less Than Others
If you have panel-level monitoring (SolarEdge, Enphase, or Huawei with optimisers), a single panel producing 20–30% less than its neighbours suggests shading, dirt, bird droppings, or a micro-crack.
What to do: Check for physical obstructions first (overhanging branches, new aerial, satellite dish). If the panel looks clean and unobstructed, ask your installer to check for micro-cracks or a faulty optimiser.
3. Inverter Communication Lost
If your app shows "no data" or "communication lost" for more than a few hours, the inverter has lost its Wi-Fi connection — or it may have shut down entirely.
What to do: Check your home Wi-Fi is working. Then check the inverter itself — if it's completely dark with no lights, it may have tripped the AC isolator. Check your consumer unit (fuse board) for a tripped MCB.
4. Battery Not Cycling Properly
A healthy battery should charge during the day and discharge in the evening. If your battery sits at 100% all evening (not discharging) or never reaches full charge, there may be a configuration issue.
What to do: Check the battery settings in your app. Common issues include the discharge schedule being disabled, minimum state of charge set too high (e.g., 90% instead of 10%), or the system being in "backup only" mode.
5. Gradual Decline Over Months
If your system's output is slowly declining year-on-year (beyond the expected 0.4–0.5% annual degradation), the panels may need cleaning, or there could be a developing wiring issue.
What to do: Compare your annual specific yield (kWh/kWp) with previous years. A drop of more than 5% warrants a professional inspection. Also check for new shading sources — a growing tree or hedge is a common culprit in rural Ireland.
Third-Party Monitoring Tools Worth Knowing
Beyond the manufacturer apps, several third-party tools can enhance your monitoring:
- myenergi app — If you have a myenergi Eddi (hot water diverter) or Zappi (EV charger), this free app shows where your solar energy is going: house, hot water, EV, battery, or grid export. It works alongside your inverter app.
- Solar Assistant — A Raspberry Pi-based monitoring tool that reads data directly from your inverter via Modbus. Popular with tech-savvy homeowners who want local control and Home Assistant integration.
- Home Assistant — The open-source home automation platform integrates with most solar inverters and batteries, letting you create custom dashboards and automations (e.g., turn on the immersion heater when solar export exceeds 2 kW).
- PVGIS — The EU's free online tool estimates expected solar output for any location in Ireland. Use it to benchmark your system's actual performance against the theoretical maximum for your roof orientation, tilt, and location.
When to Call Your Installer vs When to DIY
| Issue | DIY Fix | Call Installer |
|---|---|---|
| Wi-Fi connection lost | Reconnect via app | — |
| Tripped MCB in fuse board | Reset the breaker | If it trips again |
| Dirty panels | Hose down from ground level | — |
| Bird nesting under panels | — | Need bird-proofing mesh installed |
| Inverter error code | — | Don't open the inverter yourself |
| One panel underperforming | Check for physical obstruction | If no obstruction visible |
| Battery not charging/discharging | Check schedule settings in app | If settings look correct |
| Crackling or burning smell | Turn off AC isolator immediately | Call installer urgently |
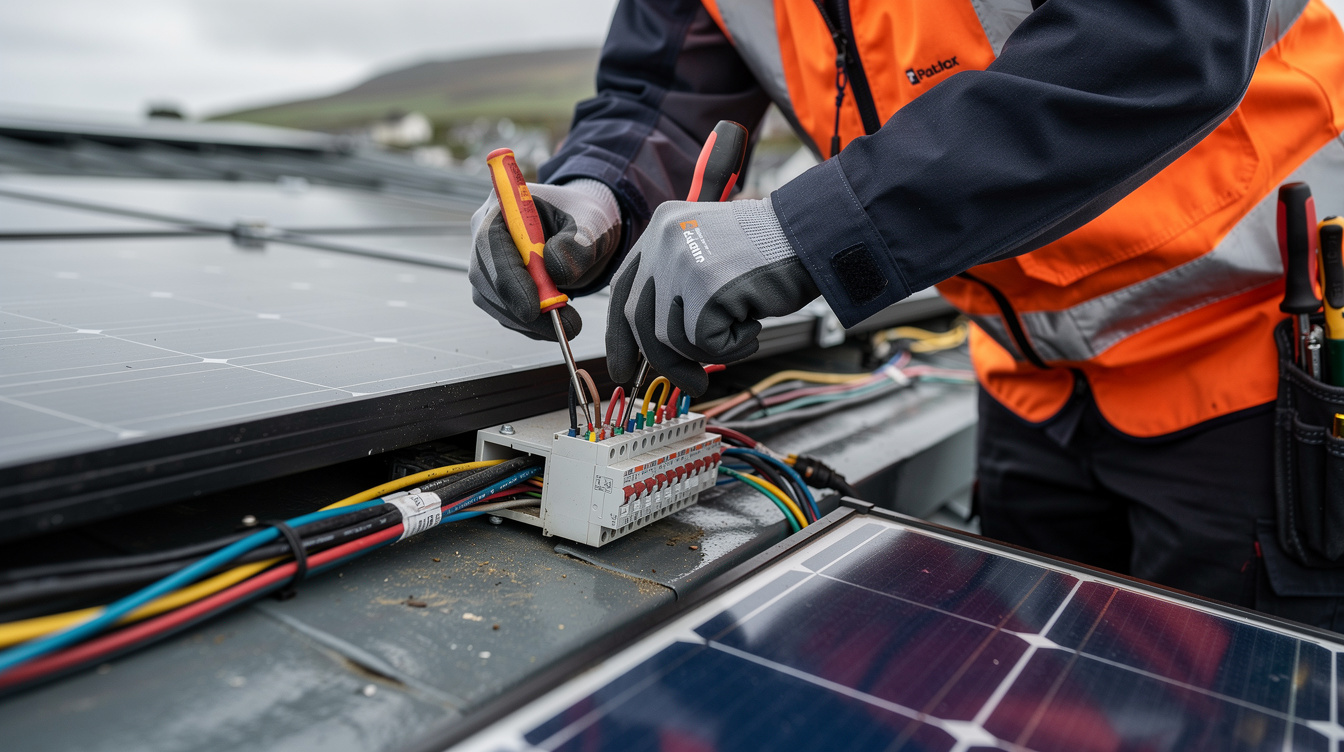
Important safety note: Never climb on your roof to inspect solar panels. Never open the inverter casing. Solar panels produce DC voltage even in low light and can cause serious electric shock. Always use an SEAI-registered installer for any physical work on the system.
How to Use Monitoring to Maximise Your Savings
Monitoring isn't just about catching problems. Smart use of your monitoring data can significantly increase your savings:
- Shift heavy loads to solar hours. Check your app's generation curve and run your washing machine, dishwasher, and tumble dryer during peak solar production (typically 10 AM–3 PM in Ireland). This maximises self-consumption and reduces grid imports.
- Optimise battery charging schedules. If you're on a time-of-use tariff, set your battery to charge from the grid during the cheapest rate window (usually 2 AM–5 AM) and discharge during peak rates (5 PM–8 PM). Your monitoring app tracks the savings.
- Track your export payments. Under the Clean Export Guarantee, you earn 18–24 cent/kWh for exported electricity. Your monitoring app shows how much you're exporting, so you can verify your supplier's payments match.
- Compare year-on-year. After 12 months of data, compare each month's output to the same month the previous year. Account for weather differences, but persistent shortfalls warrant investigation.
Want Expert Help Choosing the Right System?
Our SEAI-registered installers set up monitoring as part of every installation.
Frequently Asked Questions
Do I need internet to monitor my solar panels?
Yes, for cloud-based monitoring (all the apps listed above). Your inverter needs a Wi-Fi connection to send data to the manufacturer's servers. Without internet, the inverter still works and generates electricity — you just can't see the data remotely. Some inverters store data locally and upload it once the connection is restored.
Can I monitor my solar panels when I'm away from home?
Yes. All the apps listed work from anywhere with an internet connection. This is one of the biggest advantages of cloud monitoring — you can check your system from work, on holiday, or anywhere else.
How much data does solar monitoring use?
Very little. Most inverters upload data every 5–15 minutes, and each upload is a few kilobytes. Your monthly data usage for solar monitoring will be less than 100 MB — negligible on any modern broadband plan.
My installer set up monitoring but I never got the login details. What do I do?
Contact your installer and ask them to share the plant/system access with your email address. For Huawei FusionSolar, the installer needs to add your email as a "plant owner" in their installer portal. For SolarEdge, they need to send an invitation from the monitoring dashboard.
Is there a monthly fee for solar monitoring?
No. All manufacturer monitoring apps (FusionSolar, mySolarEdge, GivEnergy, Enlighten, Solar.web, Sunny Portal) are completely free. Some third-party platforms offer premium tiers, but the free versions cover everything a homeowner needs.
Can I see how much money I'm saving?
Most apps show energy production in kWh. To calculate savings, multiply your self-consumed kWh by your import rate (typically 37–42 cent/kWh) and your exported kWh by your export rate (18–24 cent/kWh). Some apps like GivEnergy let you enter your tariff rates and show estimated savings directly.
Related Articles

Best Solar Batteries Ireland 2026: GivEnergy vs Tesla Powerwall vs Huawei Compared
Compare top solar batteries in Ireland for 2026: GivEnergy, Huawei LUNA2000 & Tesla Powerwall 3. Full specs, pricing & ROI. Find the best value today.

Solar Panels for a Semi-Detached House in Ireland 2026: Costs, Roof Space & What to Expect
How much do solar panels cost for a semi-detached house in Ireland? Real 2026 prices, SEAI grant details, roof space guide and installation timeline.

How Long Do Solar Panels Last in Ireland? Lifespan, Warranties & What Actually Wears Out
Solar panels last 25-35 years in Ireland. Learn about degradation rates, inverter replacement, battery lifespan, warranties, and 30-year cost of ownership.