
Solar Monitoring Apps Ireland 2026: The 6 You’ll Actually Use, Compared
Once the installer’s van leaves the drive, your entire relationship with your solar system is through an app. Every Irish system comes with one — installed by default, usually before you know its name — and yet almost no one shops for the app when they shop for the panels. That’s a mistake. The monitoring platform decides whether you spot a 30% underperformance drift in month four, whether you can chase a smart tariff at 3 a.m., and whether year-eight fault diagnosis takes an afternoon or six weeks.
This is a plain 2026 comparison of the six monitoring apps you will actually encounter as an Irish solar homeowner, what each does well, and the practical gaps every one of them has.
Why the app matters more than the brochure
Solar systems fail quietly. A panel does not turn off when a bypass diode fails — it just makes 30% less energy, and the string carries on running at a lower total. An inverter with a hairline fan bearing does not shut down — it derates in the afternoon when the temperature climbs and quietly gives up 15% of your summer yield. A battery with a bad cell doesn’t stop — it holds 88% of its rated capacity forever, never quite tripping a fault code.
The only thing standing between you and losing three or four hundred euro a year to a silent fault is the app. And apps differ far more than their brochures suggest.
The six apps Irish households actually see
Every Irish 2026 solar quote resolves to one of six monitoring platforms. Which one you end up with depends entirely on the inverter your installer picks:
| Monitoring app | Comes with | Panel-level data? | Battery scheduling? | Data lag |
|---|---|---|---|---|
| iSolarCloud | Sungrow inverters | String-level only | Yes, four time bands | 30–60 seconds |
| SolisCloud | Solis inverters | String-level only | Yes, four time bands | 2–5 minutes |
| Fronius Solar.web | Fronius inverters | String-level only | Yes, via Ohmpilot/manager | 5 minutes |
| mySolarEdge | SolarEdge inverters + optimisers | Yes — every panel | Yes, three modes | 5–15 minutes |
| Enphase Enlighten | Enphase microinverters | Yes — every panel | Yes, five profiles | 15 minutes |
| GivEnergy Cloud | GivEnergy inverter + battery | String-level only | Yes — class-leading | 1 minute |
| FusionSolar | Huawei inverters + LUNA2000 | Optional (with optimisers) | Yes, AI-optimised | 5–15 minutes |
Two things fall out of the table immediately. First, only three platforms — mySolarEdge, Enphase Enlighten, and Huawei with optimisers — give you per-panel data. On every other system you see the string, not the individual panels, and diagnosing a single-panel fault means either an installer visit with a thermal camera or eight weeks of watching averages drift.
Second, the data lag varies from “live” to almost useless. GivEnergy and iSolarCloud update fast enough to control a tariff-scheduling automation; FusionSolar and Enphase both have delays that make them unsuitable for real-time optimisation and just about acceptable for daily monitoring.
What each app actually does well
iSolarCloud (Sungrow)
The workhorse app on new Irish installs in 2026 — if your installer quoted a Sungrow SH-RT hybrid inverter, this is what you get. Clean live-power view, straightforward energy flow diagram (PV/battery/grid/house), and importantly for time-of-use tariffs, four fully programmable charge/discharge windows. The alarm push-notifications are prompt and specific (fault code + suggested action). Two gaps: no per-panel data, and the “Plant Analytics” module you actually want for spotting drift is only fully available on the installer login, not the owner login.
SolisCloud (Solis)
Improved a lot since 2024 but still lags iSolarCloud on live-view responsiveness. Battery scheduling is a strength; the tariff-band editor is arguably the clearest of any Irish app. Weakness: string-level only, and the historical charts default to daily granularity rather than 5-minute intervals, so short outages are easy to miss unless you switch modes each time.
Fronius Solar.web
The most engineer-friendly of the six. Solar.web exposes raw string voltages and inverter internal temperature that no other consumer app shows, which is invaluable for diagnosis. The trade-off is that the mobile view is not as polished as SolarEdge or GivEnergy for the casual daily glance. Fronius’s Ohmpilot device (for hot-water diversion) integrates natively — useful if you also have a solar immersion diverter.
mySolarEdge
The gold standard for per-panel visibility. Every panel shows individual production — you can see the exact panel that’s shaded by the chimney at 3 p.m. in June. Long-term drift shows up as a coloured heatmap that’s genuinely useful. Downsides: the app is polished but slow (15-minute lag on the domestic view), the historical export limits data resolution unless you upgrade, and the platform’s tariff-scheduling logic is less flexible than GivEnergy’s.
Enphase Enlighten
The other per-panel-monitoring option. Enphase’s microinverter architecture means every panel is its own AC generator, and Enlighten shows each one on a live tile grid — failure of any single unit is impossible to miss. The battery integration (IQ Battery 5P) is well-designed with five different operating profiles. Enlighten is the platform where the software genuinely feels like it was designed by someone who has monitored solar systems for a decade. Downsides: expensive hardware, 15-minute average data lag, and you cannot add a third-party battery.
GivEnergy Cloud
The scheduling king. GivEnergy’s app is the only one on this list with a first-class Octopus/Bord Gáis smart-tariff integration — you tell it your electricity supplier and it can auto-schedule charging around the tariff price signal without any custom code. Open API, third-party integrations (Home Assistant, Homey), and 1-minute data resolution make this the choice for the technically curious. Weakness: it’s string-level only, and the battery-first design shows in the UX — solar-only owners find the app slightly over-featured.
FusionSolar (Huawei)
The prettiest app of the six and the smartest in raw AI terms — FusionSolar 2026 uses on-device machine-learning models to predict tomorrow’s yield based on your specific site history and the forecast, and can pre-charge the battery accordingly. But EU data-residency changes since 2024 have introduced a data delay (Huawei’s own documentation acknowledges this) that makes it borderline for true real-time monitoring. Fine for tracking; wrong choice if you want tight tariff automation.
Ask What App You’ll Actually Be Using
Compare quotes from SEAI-registered installers — and get clarity on the inverter (and app) that comes with each quote.
The five numbers every app should show you
The details vary from platform to platform, but the important numbers are the same on all of them. If you cannot find these five figures in your monitoring app within thirty seconds, either the app is misconfigured or you should replace it with a different platform at your next inverter upgrade.
- Live PV power (kW). Instantaneous generation. Sanity-check against theoretical peak: a 4.4 kWp system in bright July midday sun should be producing 3.5–4.2 kW. Consistently lower means you have a fault to investigate.
- Today’s energy generated (kWh). Total for the day so far. Compare against the same date last year in the historical view to detect drift.
- Battery state of charge (%). If you have a battery. It should hit 100% every sunny summer day and go below 10% every evening in winter — if either of those never happens, the battery is either mis-sized or the schedule is wrong.
- Grid export (kWh, live and cumulative). This is the number the CEG tariff pays on. If you cannot see it in your app you cannot verify the ESB Networks import/export register at bill time.
- Self-consumption ratio (%). The share of your generated PV that you actually used yourself, rather than exported. Higher is better for your bill; typical Irish 4–5 kWp systems without a battery sit at 35–45%. Adding a battery can push this above 75%.
How to spot a fault before the app tells you
App fault alerts are useful but late. By the time an inverter throws a formal fault code, generation has usually been degraded for weeks. The three drift checks worth doing every month:
- Same-day-last-year comparison. Nearly every app can overlay this. A 10%+ shortfall against the same day last year in the same weather — and not the odd cloudy afternoon — is a real red flag.
- Panel-count math. Peak power today ÷ panel count = kW per panel. Should be roughly 0.9 × the panel’s nameplate wattage in bright direct sun. Anything materially below suggests soiling, shading, or a failed bypass diode.
- Battery cycle count. Compare month-over-month. If your cycle count doubles in a month with no tariff change, something has changed with your load schedule or a phantom load is bleeding the battery overnight.
These three checks take five minutes a month and are the practical difference between spotting a fault at €80 of lost yield and spotting it at €500.
App gotchas specific to Ireland
- ESB Networks smart meter data is not in the app. The generation and export figures in the monitoring app are from the inverter’s own CT clamp, not from ESB Networks’ smart meter. They will disagree by 3–5%. Only the ESB Networks figure counts for CEG payment — the app number is for troubleshooting.
- Data goes home to China / Germany / US. Every one of these platforms sends your live-power data to a server outside the EU or in a specific EU region. If you care about that from a privacy standpoint, only Fronius (Austria) and Enphase (Ireland-hosted for EU customers as of 2025) keep it inside the EU by default.
- Firmware updates can break battery scheduling. A recent Sungrow SH-RT firmware in late 2025 reset several Irish users’ charge windows to defaults. Check schedules after any firmware push notification.
- Offline gaps count against you. Home broadband outages don’t stop the inverter running but do create data-gaps in the app. Cumulative energy totals in the app therefore under-report if you had outages — another reason to reconcile against the ESB Networks reading at bill time.
Choosing the right app when you choose the inverter
The app is a real decision, not a footnote. When you sit down with a shortlist of quotes, ask the installer these four questions:
- What monitoring app does this system come with?
- Is it panel-level or string-level?
- Does it support four programmable charge/discharge windows for time-of-use tariff optimisation?
- Can I get read-only guest access for a family member or a diagnostic technician if we call one in year 8?
If the answer to any of these is a shrug, that is useful data about how the installer thinks about the system after the panels go on the roof. See our full guide to comparing solar quotes in Ireland for the rest of the checklist.
Frequently asked questions
Do I have to use the manufacturer’s app?
Yes, at least for the primary system telemetry — the inverter only speaks to its own cloud platform for firmware, warranty logging, and remote diagnostics. Third-party tools (Home Assistant, Solar Analytics, Solcast) can layer on top for extra analysis, but you cannot replace the manufacturer app on the system itself.
Does the app cost anything?
All six platforms above are free for the system owner for the life of the inverter. Some (SolarEdge, FusionSolar) offer paid tiers for professional installers with fleet management and finer-grained analytics that most homeowners do not need.
Can I see my export tariff earnings in the app?
No app on the Irish market currently shows CEG earnings in euro directly. The export kWh figure is there; the euro conversion is on your electricity bill and depends on your supplier’s CEG export tariff.
What if my Wi-Fi is unreliable?
Almost every inverter falls back to storing data locally for 24–72 hours and uploading when connectivity resumes. But you lose live monitoring during the outage — a wired Ethernet or PLC (power-line-communication) connection from the inverter to the router is a €40 upgrade that pays back in reliability.
Do these apps work with Home Assistant or Homey?
GivEnergy has the best documented open API and works natively with Home Assistant and Homey. Sungrow, Solis, and SolarEdge have community-maintained integrations that work but are not officially supported. Enphase has an official but limited developer API. FusionSolar and Fronius sit somewhere in between.
Ready to Compare Systems (and Their Apps)?
Get free 2026 quotes from SEAI-registered Irish installers — with clear info on the inverter, app, and monitoring stack you’ll be living with.
Related Articles
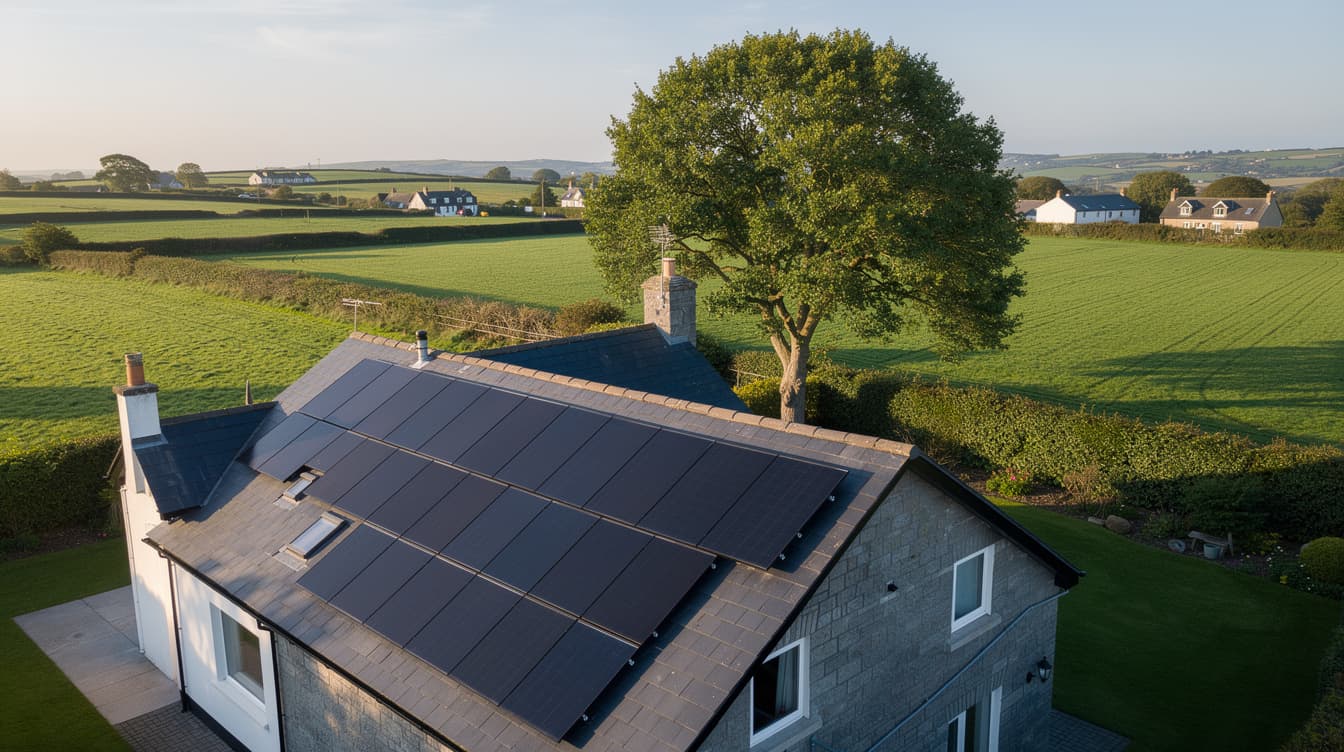
Solar Panel Shading Ireland 2026: Trees, Chimneys & Real Output Loss
How much output do you lose from trees, chimneys or dormers shading Irish solar panels? 2026 guide with mitigation costs and decision tree.

Time of Use Tariffs & Solar Panels Ireland 2026: Smart Meter Strategy
Which Irish smart meter tariff pairs best with solar? 2026 supplier comparison, load-shifting rules, worked payback example and CEG rate gotchas.
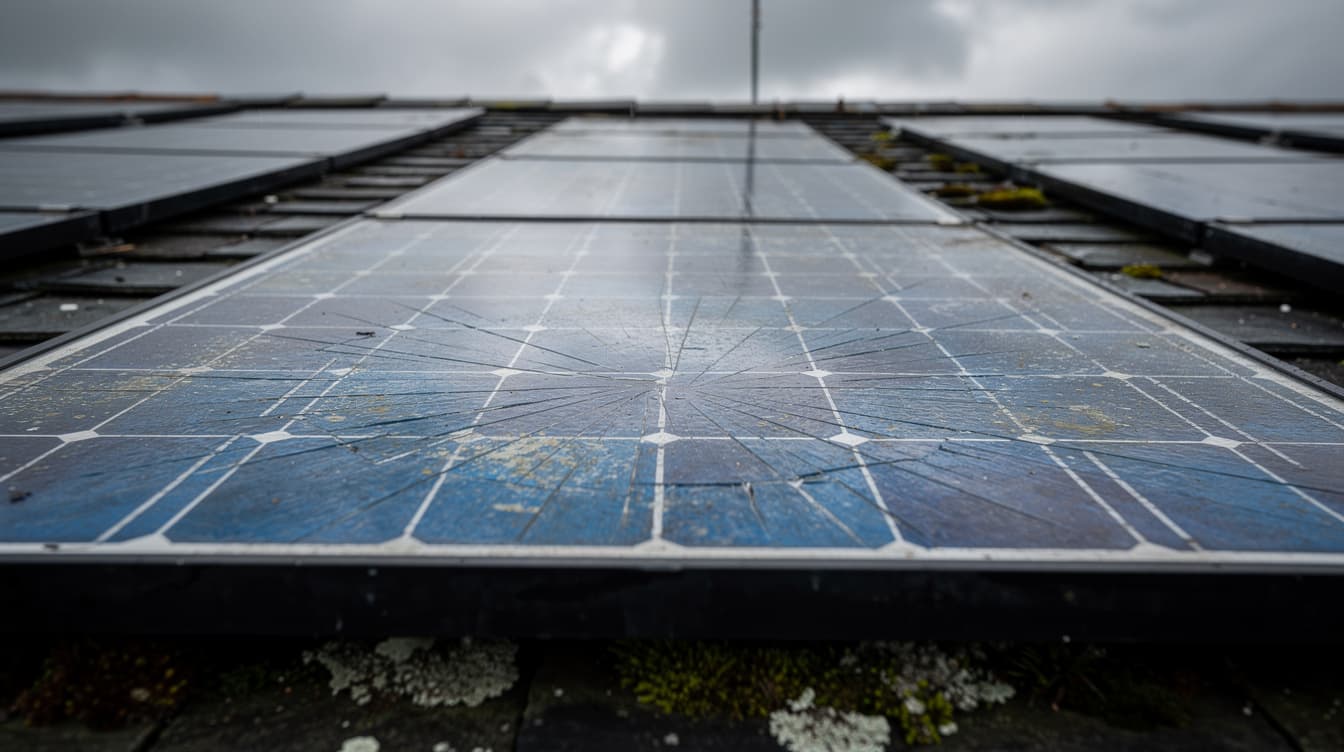
Solar Panel Faults & Repairs Ireland 2026: What Really Goes Wrong (and What It Costs)
The 8 solar system faults Irish installers see most, honest 2026 repair costs, and how to spot silent under-performance before it drains your CEG earnings.